在上一节的最后我提到Feign集成了Hystrix实现了容错功能。
这一节我们看下Hystrix有什么本事以及利用Feign实现Hystrix的这些功能。
Hystrix特性
- 服务隔离机制 Hystrix是一个熔断器模型的具体实现,熔断器就类似于保险丝,单个电器故障使保险丝熔断以防止故障蔓延造成更大损失 容错机制就是这个原理
- 服务降级机制 当服务提供者无法访问时不能让消费者一直等待或返回代码异常栈显得很不友好。这时返回fallback中定义的异常信息实现降级处理
- 实时的监控与报警功能,可迅速发现服务中存在的故障。
基于Feign实现Hystrix
在上一节我们已经实现了Feign这样一个客户端,我们可以直接在此基础上实现Hystrix的熔断与降级机制
在consumer的配置文件添加配置
  feign:
    hystrix:
      enabled:
        true #熔断器
还需实现FeignClinet 接口创建降级回调类,返回降级信息
@Component
public class FeignHystrix implements FeignClinet {
@Override
public List<Instrument> getAllByFeign() {
return null;
}
@Override
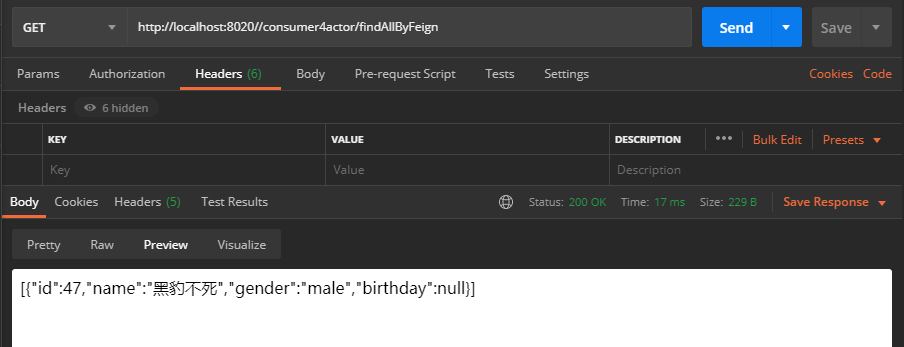
public List<Actor> findAllByFeign() {
List<Actor> list = new ArrayList<Actor>();
Actor actor = new Actor();
actor.setId(47L);
actor.setGender("male");
actor.setName("黑豹不死");
list.add(actor);
try {
throw new Exception("Sorry,the function is unreachable");
} catch (Exception e) {
e.printStackTrace();
}
return list;
}
}
并在FeignClinet 的@FeignClient 注解中声明fallback类:
    @FeignClient(value = "provider", configuration =FeignAutoConfiguration.class,
        fallback = FeignHystrix.class)
这样设置完成后,当正常的provider服务不可达时,熔断时调用降级信息
Dashboard可视化监控
Hystrix提供了近乎实时的请求监测功能,这个功能结合Spring Boot
Actuator 实现,可以看到Hystrix Command
的请求信息,当然它返回的是文本信息不够直观,我们可以再结合 Hystrix-dashboard
得到可视化的监控界面。
仍然利用上一节中的FeignClinet来实现Hystrix的功能特性
在pom文件中添加Hystrix、actuater、dashboard依赖
仍然利用上一节中的FeignClinet来实现Hystrix的功能特性
在pom文件中添加Hystrix、actuater、dashboard依赖
  <dependency>
     <groupId>org.springframework.cloud</groupId>
     <artifactId>spring-cloud-starter-netflix-hystrix</artifactId>
  </dependency>
  <dependency>
     <groupId>org.springframework.boot</groupId>
     <artifactId>spring-boot-starter-actuator</artifactId>
  </dependency>
  <dependency>
     <groupId>org.springframework.cloud</groupId>
     <artifactId>spring-cloud-starter-netflix-hystrix-dashboard</artifactId>
  </dependency>
在启动类需要添加注解@EnableHystrix声明启用Hystrix;添加@EnableHystrixDashboard声明启用dashboard。依次启动eureka、provider、consumer后,将出现: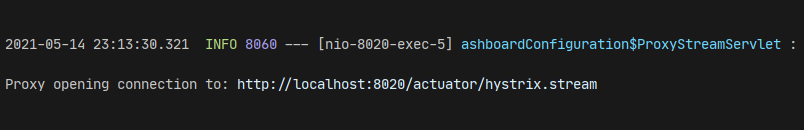
访问该地址将看到command的详细信息:
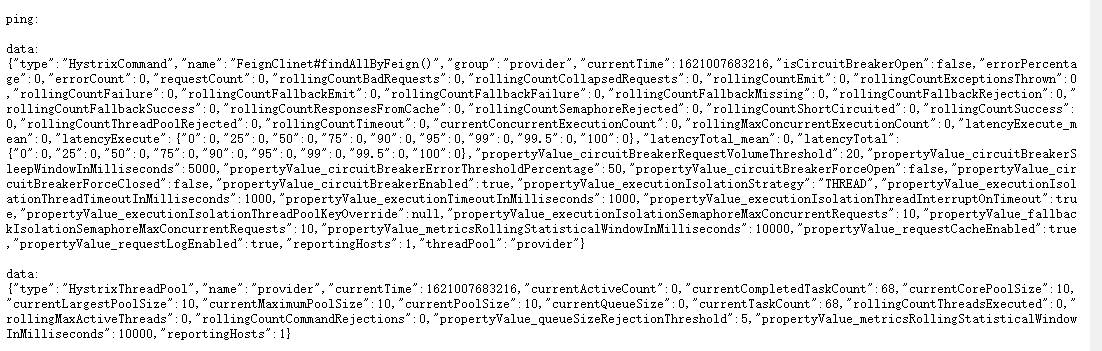
显然它十分的不友好,为了更直观的获得资讯,我们此时访问
http://localhost:8020/hystrix输入监控地址http://localhost:8020/actuator/hystrix.stream点击开始监测: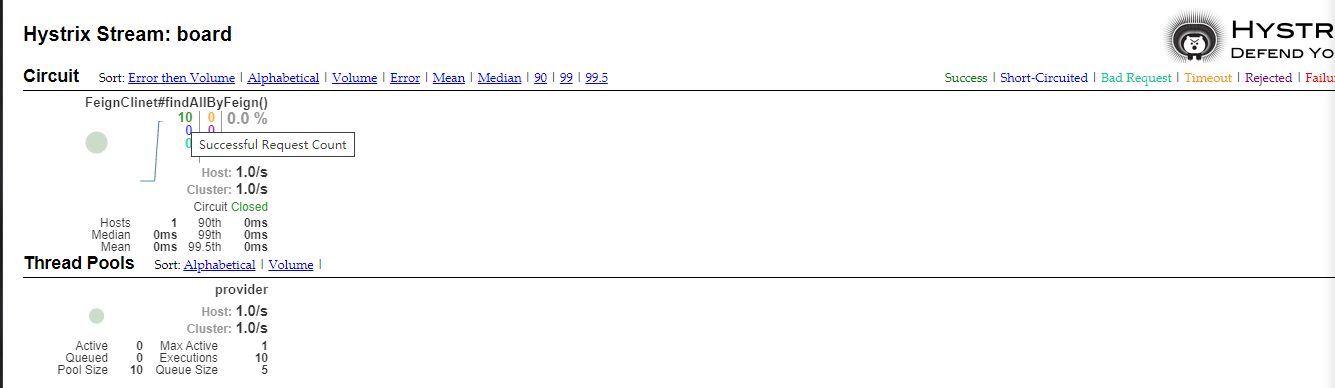
这时我们可以得到较为直观清晰的监控界面,能获取到包括请求成功、熔断、失败、超时的数量等诸多信息。至于监控界面各参数具体信息请查阅hystrix-dashboard wiki
No comments:
Post a Comment